
 Juliana — Sales & GTM expert
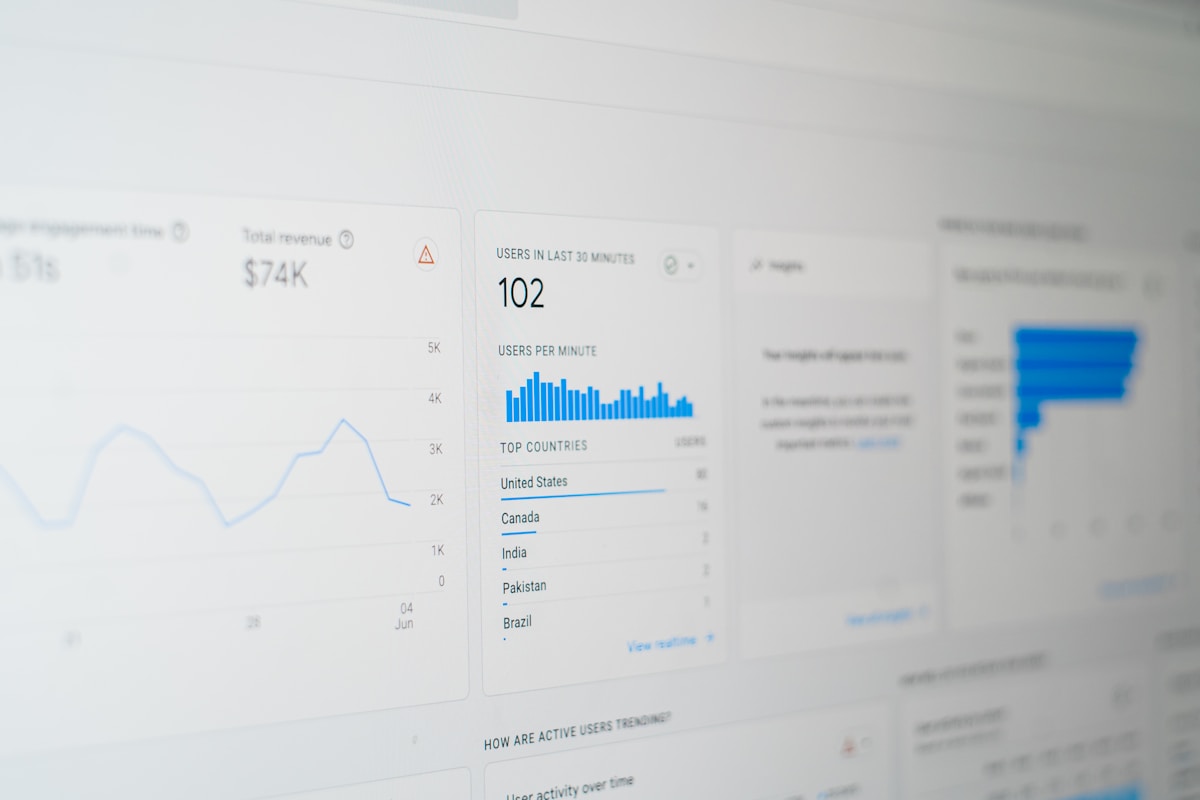
A competitor intelligence dashboard is only as useful as the action it produces. Most teams build one, fill it with logos and pricing comparisons, and then watch it collect dust. The dashboards that actually move pipeline share a common trait: they surface a specific list of companies for reps to call, not a general summary of the competitive landscape.
- The most actionable CI dashboards lead with a live, filterable list of companies using each competitor — not just market positioning data.
- Job postings are the single most reliable public signal for identifying confirmed competitor users at scale.
- According to Crayon's State of Competitive Intelligence report, companies with a dedicated CI function win 47% more competitive deals than those without one.
- Structure your dashboard in two layers: strategic (for management) and tactical (for reps). Reps need a prospecting queue, not a briefing document.
- Tools like Stealery handle the hardest part — building the live competitor user list — so you can focus the rest of your dashboard on how to win those accounts.
What data belongs in a competitor intelligence dashboard?
A competitive intelligence dashboard should contain exactly what a rep needs to open a conversation and what a manager needs to coach a deal — nothing more. The mistake most teams make is building a research library when they need a prospecting tool.
There are two distinct layers of data every CI dashboard needs:
Layer 1: Tactical data (for reps)
- Live competitor user list: Companies confirmed to be using a specific competitor right now, filterable by size, geography, and industry.
- Hiring signals: Job postings that mention the competitor's product — these confirm active usage and often signal a pain point (e.g., a company hiring a "HubSpot Administrator" is both a confirmed user and potentially overextended on that tool).
- Outreach status: Which companies on the list have already been contacted, by whom, and what happened.
- Deal stage: Active competitive deals in the CRM, tagged by which competitor is involved.
Layer 2: Strategic data (for managers and enablement)
- Win/loss by competitor: What percentage of deals where Competitor X appears do you win? How has that trended over the last 90 days?
- Competitive deal cycle: Do deals with a named competitor take longer to close? By how much?
- Objection frequency: What are reps hearing most often in competitive deals? This feeds battlecard updates.
- Competitor pricing and positioning changes: Market-level shifts tracked via review sites, job postings, and press.
Most CI tools focus on the strategic layer. The tactical layer — the actual list of companies to call — is where the pipeline comes from, and it's consistently the hardest part to populate with fresh, accurate data.
How do you find which companies are using your competitors?
The most scalable method is job postings. A company that lists a competitor's product in a job description is a confirmed active user — this data is public, constantly refreshed, and covers millions of companies globally. It requires no contact with the target company and no third-party data agreement.
Beyond job postings, there are three other reliable signals:
1. G2 and Capterra reviews
Review platforms publish the company name and role of every reviewer. A company that has reviewed your competitor in the last 12 months is almost certainly an active user. The limitation is coverage — only a fraction of users leave reviews, so this works better as a signal layer on top of a larger list than as a primary source.
2. LinkedIn company pages and employee profiles
Employees often list tools in their skills or job descriptions. Searching LinkedIn for profiles that mention a specific software name, filtered by company, surfaces confirmed users. This is manual and doesn't scale well beyond 50–100 companies without automation.
3. Purpose-built competitor intelligence tools
The fastest way to build and maintain this list at scale is a tool built specifically for it. Stealery works exactly this way: you type in a competitor name and get a live list of every company using it, filterable by size, location, and hiring signals. What would take a full day of manual research takes about 30 seconds, and the list stays current without any maintenance on your end.
Whatever source you use, the critical rule is freshness. A competitor user list that's six months old has significant decay — companies switch tools, contracts end, and org structures change. Build a refresh cadence into your dashboard from day one.
How should you structure a CI dashboard for a sales team?
Structure your CI dashboard around the job-to-be-done for each user type. A rep opening the dashboard at 8am needs to see a prioritized list of companies to contact. A VP of Sales checking in on Friday needs to see competitive win rate trends. These are different views of the same underlying data.
The rep view: a prospecting queue, not a briefing
The rep-facing section of your dashboard should look like a CRM queue, not a slide deck. It should show: company name, competitor they use, company size, location, last hiring signal date, and outreach status. One row per company. Sortable. Exportable. Nothing else.
Reps should be able to filter this view by territory, competitor, company size, and whether they've been contacted. The goal is that a rep can open the dashboard, filter to their territory, see 15 uncontacted companies using Competitor X, and start dialing — without reading a single paragraph of market analysis.
The manager view: competitive deal health
Managers need to see where competitive deals are in the pipeline and whether the team is winning them. A simple bar chart showing win rate by competitor, updated weekly from CRM data, is more useful than a 40-page market report. Add a trendline so you can spot when a competitor starts gaining ground before it becomes a quarterly miss.
The enablement view: battlecard triggers
Connect your CI dashboard to your battlecard library. When a rep logs a competitive deal in the CRM, the dashboard should surface the relevant battlecard automatically — not require them to go find it. This is often a simple CRM workflow rule, not a complex integration.
"The best competitive intelligence programs I've seen don't try to predict what competitors will do next. They focus obsessively on one question: which accounts should we call today, and what do we say when we get them on the phone?"
— Jon Miller, Co-founder of Marketo and Demandbase, on B2B go-to-market strategy
What tools do you need to build a competitive analysis dashboard?
You don't need a dedicated BI platform to build a functional CI dashboard. Most teams at 10–200 person SaaS companies can get 80% of the value from tools they already have, plus one or two additions.
The minimum viable CI stack
| Layer | Tool options | What it does |
|---|---|---|
| Competitor user list | Stealery, manual job board scraping | Identifies companies actively using each competitor |
| CRM / system of record | HubSpot, Salesforce | Tracks outreach status, deal stages, win/loss tagging |
| Market monitoring | Crayon, Klue, Google Alerts | Tracks competitor messaging, pricing, product changes |
| Intent data (optional) | Bombora, G2 Buyer Intent | Identifies in-market buyers actively researching competitors |
| Dashboard / visualization | HubSpot reports, Notion, Google Sheets | Surfaces data in a usable format for reps and managers |
For teams just starting out, a Google Sheet with a manually refreshed competitor user list and a HubSpot dashboard for win/loss tracking is a legitimate starting point. The important thing is having a defined refresh process — a dashboard with stale data actively damages rep trust.
Gartner research on sales enablement consistently shows that tool adoption is the primary failure point for CI programs — not data quality. Reps abandon tools that require too many clicks or don't integrate with their existing workflow. Build for the workflow first, data richness second.
If you're building this from scratch, start with the competitor user list — it's the highest-leverage input and the hardest to build manually. From there, layer in win/loss tracking in your CRM, then market monitoring. Don't try to build the full stack on day one.
How do you get your sales team to actually use the dashboard?
The fastest way to kill a CI program is to make it a reference tool instead of a workflow tool. If reps have to seek out the dashboard, they won't. It has to show up in the workflow they're already in.
Embed CI into existing workflows
The most effective integration point is the CRM. When a rep logs a new opportunity, prompt them to tag the competitor. When they enter a deal into a specific stage, surface the battlecard automatically. When they're building a prospecting list, surface competitor-using companies as a filter option — not a separate tab they have to open.
Make the list the start of the day, not the end
Teams that use CI data consistently tend to build a simple ritual: every morning, each rep opens the competitor user list filtered to their territory, picks 10–15 companies they haven't contacted, and those become their call block for the day. The dashboard isn't a research project — it's a queue. Frame it that way in onboarding and it sticks.
Show the win rate data in team meetings
Nothing drives adoption like evidence. Pull up competitive win rate data in your weekly pipeline review and show the correlation between using CI data for outreach and the quality of conversations reps are having. When a rep closes a deal with a competitor-using company they sourced from the dashboard, call it out. That story does more for adoption than any training session.
How do you measure whether your CI program is working?
Three metrics tell you most of what you need to know about CI program health: competitive win rate, pipeline sourced from competitor-targeted outreach, and rep engagement with CI data.
Competitive win rate
Track the percentage of deals where a specific competitor appears that you win. Segment by competitor — your win rate against Competitor A and Competitor B will be different, and the trend lines will diverge. If your win rate against a competitor drops two quarters in a row, that's an enablement problem that the dashboard should be surfacing before it becomes a board conversation.
Pipeline sourced from competitor-targeted lists
Tag opportunities sourced from CI outreach in your CRM from day one. Over time, this gives you the cleanest ROI number for the program: deals created and revenue won from accounts you identified specifically because they were using a competitor. This is the number that justifies the tool budget.
Rep engagement
How many reps are opening the dashboard weekly? How many opportunities are being tagged with a competitor? If engagement drops, the data is stale or the workflow is too manual. Engagement is a leading indicator — revenue impact is a lagging one. Watch engagement first.
According to Crayon's State of Competitive Intelligence report, 69% of businesses say competition has significantly increased in the past three years, yet fewer than a third have a structured CI program with defined metrics. The teams that do have one consistently outperform on competitive deal win rate — by as much as 47% in companies with dedicated CI resources. The gap between having a dashboard and not having one is measurable, and it compounds over time as the list of identified competitor accounts grows.
Frequently asked questions
Ready to build your first competitor list?
Type in any competitor and see every company using it — filtered by size, location, and hiring signals.
Try Stealery for free →